This website uses cookies so that we can provide you with the best user experience possible. Cookie information is stored in your browser and performs functions such as recognising you when you return to our website and helping our team to understand which sections of the website you find most interesting and useful.
What is a Customer Experience Data Diagnosis?
In today’s competitive landscape, where businesses strive to stay ahead, understanding and improving customer experience has become paramount.
To achieve this, organisations rely on data diagnosis, a process that involves analysing and interpreting data to gain valuable insights into customer behaviour. By harnessing the power of data discovery and employing sophisticated data diagnosis tools and services, businesses can unlock the potential to enhance customer experience and drive growth.

Unravelling the Intricacies of Customer Experience
Data diagnosis is a comprehensive approach to unravelling the intricacies of customer experience. It enables organisations to delve into the vast ocean of data collected from various sources, extracting meaningful information to gain a deeper understanding of their customer’s preferences, expectations, and pain points. By leveraging data diagnosis, businesses can effectively identify opportunities for improvement, develop targeted strategies, and optimise customer engagement across different touchpoints.
Understanding Data Diagnosis
To fully grasp the concept of data diagnosis, it is crucial to understand its key components and principles. The following components form the foundation of an effective process:
By embracing these key components and principles of data diagnosis, organisations can unlock the full potential of their customer data, gain actionable insights, and drive continuous improvement in customer experience.
The Process of Data Discovery
Data discovery is a crucial phase in the data diagnosis process, aimed at uncovering valuable insights and patterns within a dataset. It involves various methodologies and tools that enable analysts to explore, profile, and visualise data, ultimately facilitating a deeper understanding of the information at hand.
Data Profiling
Data profiling is the initial step in data discovery, focusing on assessing the quality, completeness, and structure of the dataset. It involves examining the data’s metadata, such as column names, data types, and value distributions. By analysing data statistics, data profiling helps identify anomalies, missing values, and potential data quality issues. The objective is to gain a comprehensive overview of the data’s characteristics, enabling analysts to make informed decisions during subsequent analysis.
Exploratory Data Analysis (EDA)
Exploratory data analysis is a technique employed to gain insights into the dataset’s underlying patterns, relationships, and distributions. It involves the application of statistical methods and visualisations to summarise and explore the data. EDA techniques, such as summary statistics, correlation analysis, and distribution plots, help analysts understand the data’s central tendencies, variations, and potential outliers. By identifying patterns and trends, EDA provides a foundation for further analysis and hypothesis generation.
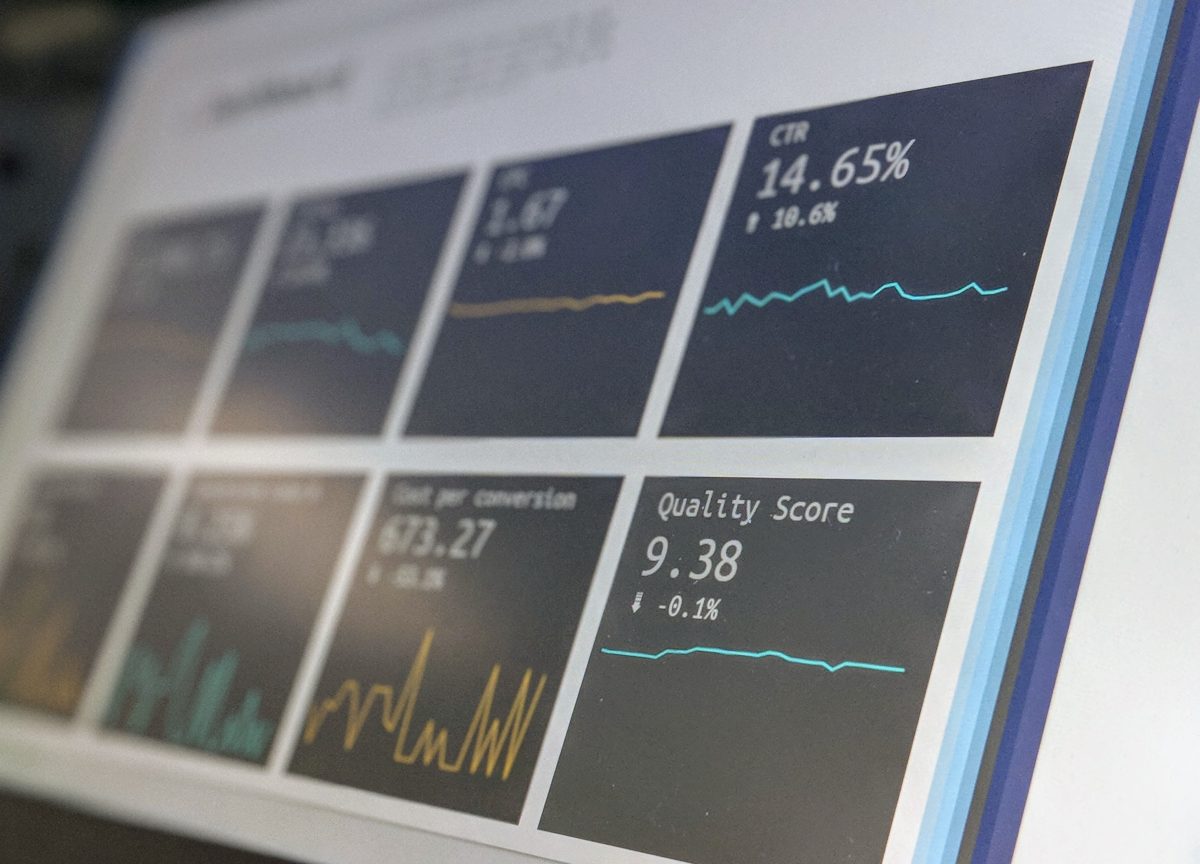
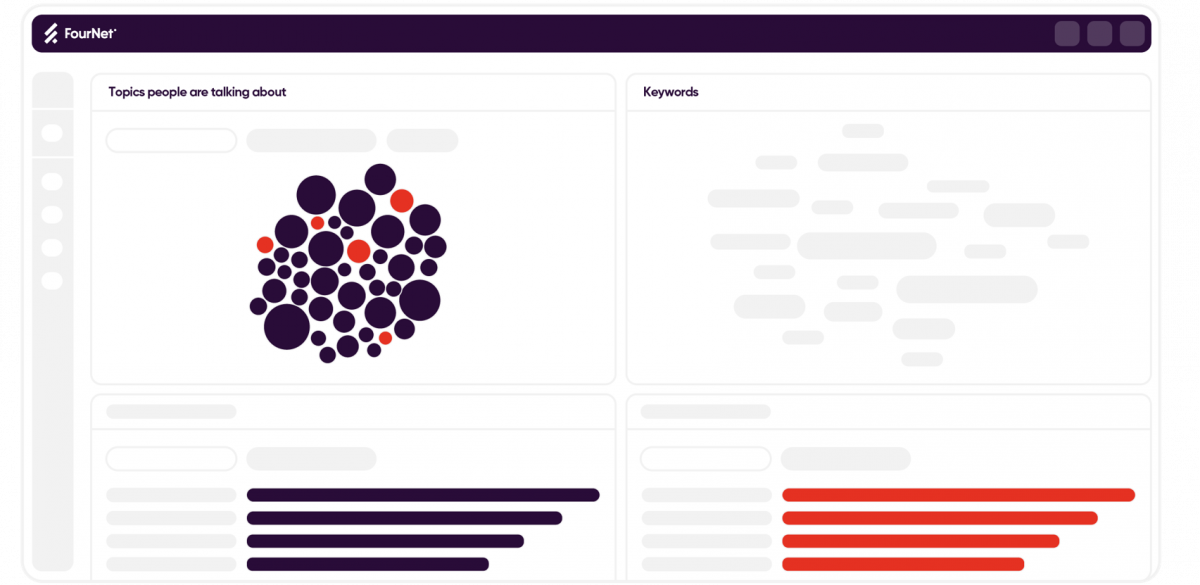
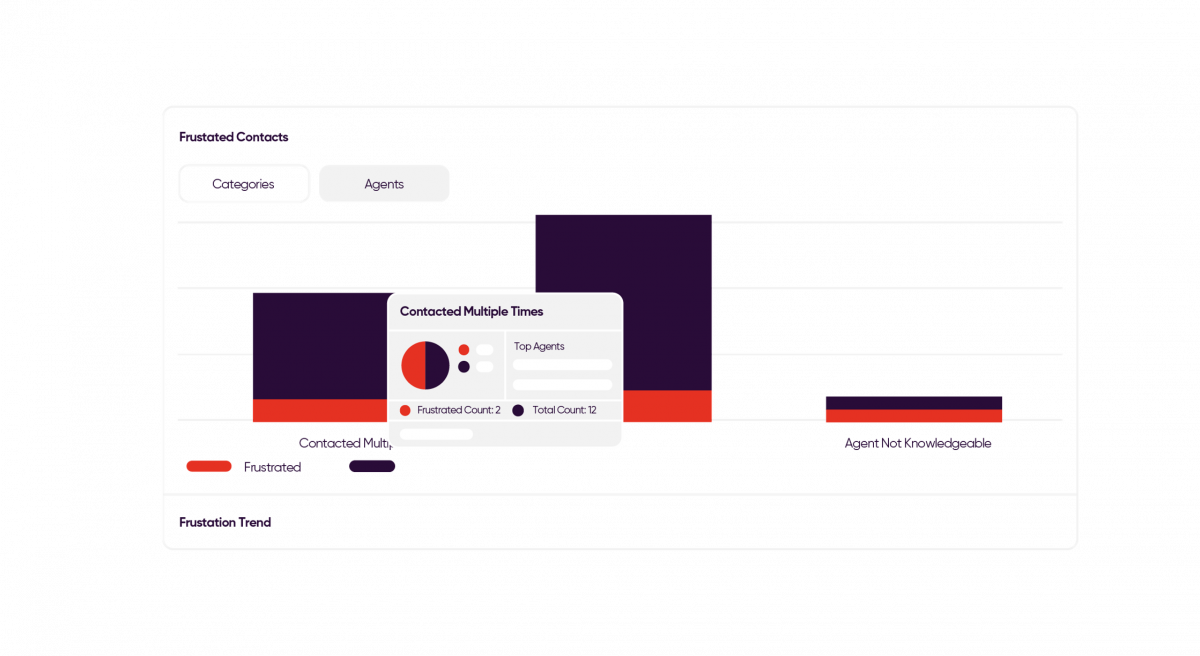
Data Visualisation
Through the use of visual elements, including bar charts, line graphs, scatter plots, and heatmaps, analysts can uncover patterns, trends, and relationships that may not be apparent in raw data. This aids in identifying actionable insights and presenting them in a compelling manner.
Data Sampling
Sampling techniques, such as random sampling, stratified sampling, and cluster sampling, ensure that the selected subset accurately represents the characteristics of the complete dataset. By analysing the sample, analysts can draw conclusions and make inferences about the entire dataset.
Data Documentation
Recording important information about the dataset, including its source, structure, and any transformations or preprocessing steps performed ensures transparency, reproducibility, and knowledge sharing among analysts and stakeholders. It helps maintain data integrity, facilitates collaboration, and enables future reference and reuse of the dataset. Documentation should include details such as data dictionaries, variable definitions, data collection protocols, and any assumptions or limitations associated with the data.
Book a Free Data Diagnostic
Enter your details here and we will be in touch to kick off your data diagnosis.